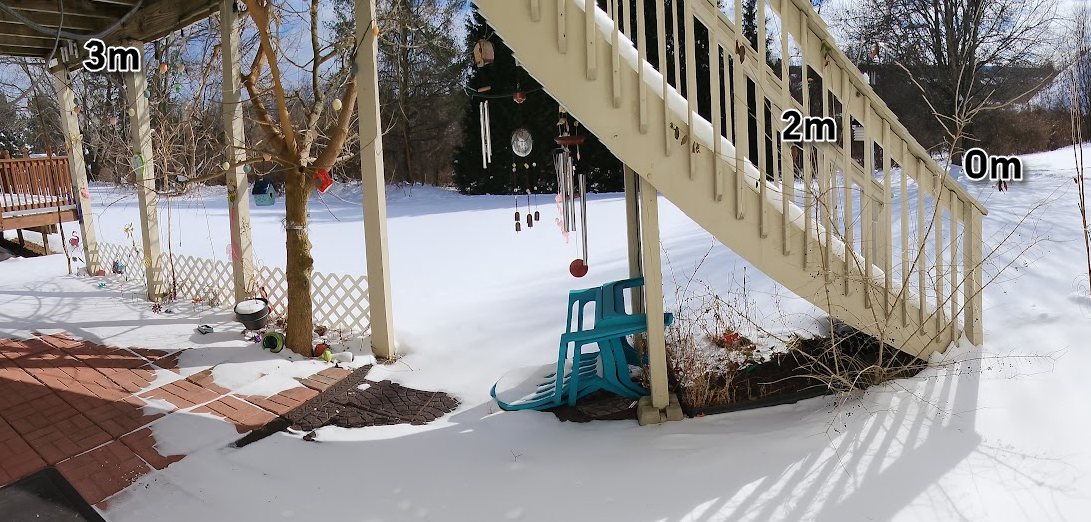
In 2022, I installed a new Davis Vantage Pro 2 Plus weather station at my house. While the temperature sensor for the station was installed at standard meteorological height – 2 meters – I also installed another ground sensor at 3 meters, or about 10 feet, under my porch and a temperature probe that sits near 0 meters (ground level) at the edge of my yard.

Meteorologists know that air near the ground (assuming calm winds) is generally the coldest, and it warms as you go up in height (to a point). This is why there is a meteorological standard of sensors being located at 2 meters. A thermometer on the ground will generally read too low, while one on the roof will read too high (not only because of the placement but because of radiation from the roof, but that’s another instrumentation siting story.
When we had a particularly cold morning yesterday, I looked at the graphs of the 3 sensors on the Davis WeatherLink.com website for the past two weeks or so. True to form, the highest sensor (3 meters) was the warmest over the last week, and the ground sensor at 0 meters was the coldest, especially at night (except when the sun warmed the ground).

But then something interesting happened. The 0 meter ground sensor suddenly spiked above the other two, and stayed there. This is because we got a foot of snow that day, which buried and insulated the sensor from the cold. We haven’t even lost half that snow yet, so the effect, shown by the purple box, continues.
It turned out that yesterday’s low temperature, -11.8 F, (let’s say “-12”) was what I believe to be the third-coldest temperature I’ve ever experienced. I moved to Pennsylvania in 1997. The previous two cold snaps were:
I added a wind graph to note that, when things were calm, the temperature dropped very quickly. This is another meteorological relationship, especially at night when the wind stirs air at different temperatures, it averages higher than when there is no wind and the earth simply radiates warmth away. The red lines indicate when this happened.