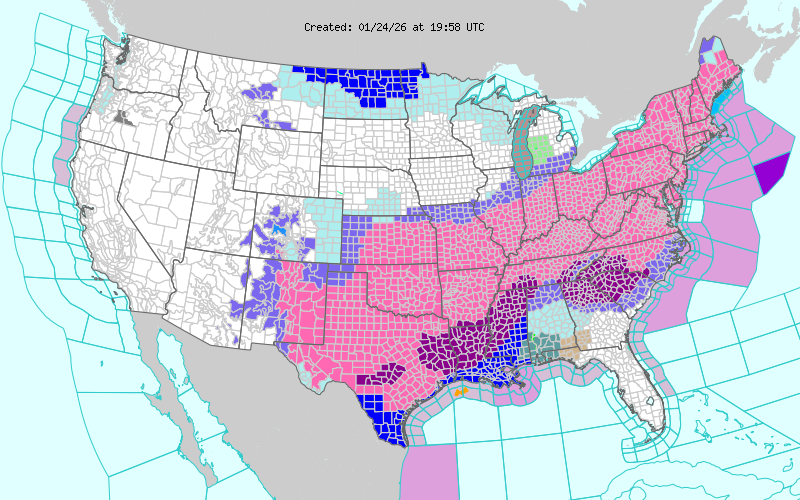
Meteorologists and weather enthusiasts have said the late-January snowstorm was the biggest in memory for NWS Winter Weather Watches & Warnings in effect at the same time. This map shows the advisories as of Jan. 24 at 20:00 UTC time:

While there’s no easy way to answer that question, I spent some of my spare time over the last couple weeks on research which indicates that it was the biggest winter storm since at least 2014 by population, but not by area.
It ranked #1 for:
Total Population in Winter Weather Advisories (2021 Winter Outbreak Was #2)
Total Population in Cold Advisories (2021 Winter Outbreak Was #2)
Total Population in Winter & Cold Advisories (2021 Winter Outbreak Was #2)
But did not rank #1 for area (sq km):
Total Area in Winter Weather Advisories: #2, beaten by the 2021 Winter Outbreak
Total Area in Cold Weather Advisories: #2, beaten by the 2021 Winter Outbreak
Total Area in Winter & Cold Advisories: #2, beaten by the 2021 Winter Outbreak
How quickly we forgot this map of the 2021 storm:

So, the Feb. 14, 2021 Winter Outbreak & the Jan. 24, 2026 Winter Storm were #1 in all the categories above.
Interesting Notes:
It’s not as uncommon as I would have thought to have > 100 million people in Winter advisories, in fact that has happened at least a dozen times since 2014.
The Feb. 1, 2011 storm was probably the runner-up… it won some categories when wind was included, and also ranked #3 overall for Winter Advisories. Because of the unusual wind, it ranked as the #2 Total Advisories, beating 2026.

On the map above from the 2026 storm, there were 148 million people under Winter Storm Warnings. This is exceedingly rare. I only found more than 100 million people under any warning during any of these storms twice — 100 million in Winter Storm Warnings on Feb. 1, 2011, and 102 million under a Wind Advisory on Mar. 11, 2022. Feb. 14, 2021 was close with 94 million.
Here’s all the data:
Disclaimers/Methodology:
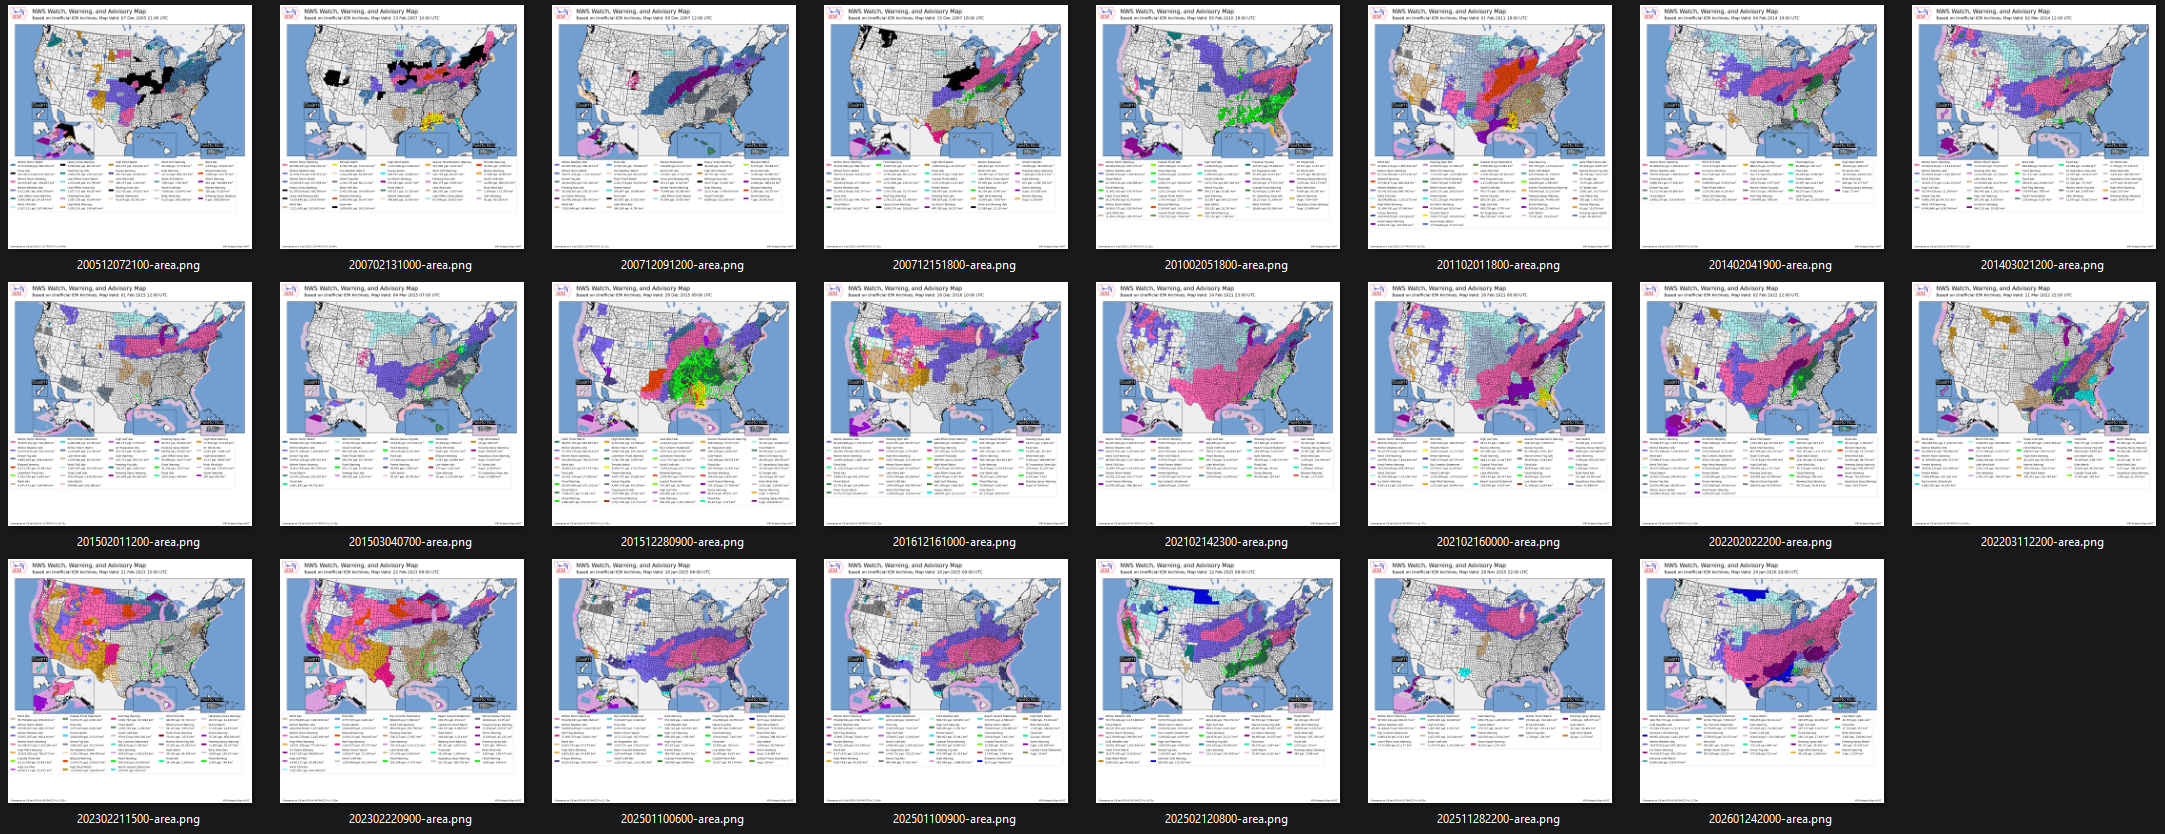
This wasn’t easy because IEM only has downloadable U.S. advisory map archives back to 2014. I eyeballed a 1x/day NWS Advisory map from IEM’s archives from 2014-2026, copying dates that appeared to have a significant part of the country in purple/pink/black (Winter) or light blue (Cold). I then took each date and went forwards/backwards 24 hours to find what appeared to be the largest areal coverage. That gave me a couple dozen.

I also tagged particularly big storms that I happened to have advisory screenshots of from storms I blogged about in 2005, 2007 (3), 2010 and 2011.
I then accessed the Population and Area statistics from IEM’s Autoplot 247 for those dates and times, and added up the Population & Area totals for various kinds of Winter, Cold, and Wind advisories. I ignored Coastal/Marine/Lakes advisories and smaller numbers that wouldn’t contribute significantly to the totals.
From this I was able to do Conditional Formatting in Excel to indicate highs and lows for each column, and assign rankings for each column.
NOTE: Totals for Alaska & Hawaii were added into these numbers because IEM doesn’t list them separately. While that could have created overages for some years, it wasn’t a problem in the biggest years examined (2021 & 2026).
NOTE: Wind ended up being an unecessary statistic that was the most likely to be wrong, because I wasn’t looking for Wind advsiories when eyeballing the maps. It’s also possible that the Cold Advisories statistics suffered from some, but not as much, bias for first reason.
NOTE: Because, for simplicity, I picked a point in time, there are almost surely storms that had bigger areas or population over several days, but none that affected such a large population or area as 2026 or 2021.